I built software for a research group with two short prompts to Ninox AI: one to create the foundation and one to add a research overview. Below you'll find both prompts, ready to copy, along with what Ninox AI created each time. This is the third episode of Built in Ninox, the column where I pick an industry, describe what it needs in plain language, and show you how to build it yourself. This time, we're heading into the lab.
One note before you start: our team keeps improving Ninox AI, so your result may look a little different from mine. The structure will be close, and you can always ask Ninox AI to adjust anything that doesn't fit.
Step 1: build the foundation
My first attempt was a single sentence: "I need something to manage my research projects." Ninox AI replied with two quick questions about what to track and whether to add demo data. The prompt below already includes my answers, so you can skip the questions and get the same result in one go. On an AI-native low-code platform, plain language is all you need.
Here's the prompt to use:
I need something to manage my research projects, with team members, tasks and milestones, and publications. Please add some sample data so I can see how it works.
Before changing anything, Ninox AI showed me the data model and waited for my approval. It proposed four linked tables: Team members, Projects, Tasks, and Publications. Every project has a lead, every task belongs to a project and an assignee, and every publication links back to the project it came from. So when a funder asks what a grant produced, the answer is one click away. After a second approval, Ninox AI filled the tables with 6 team members, 6 projects, 16 tasks, and 8 publications.
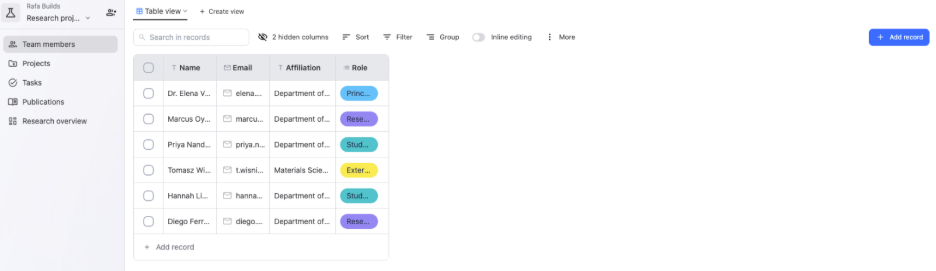
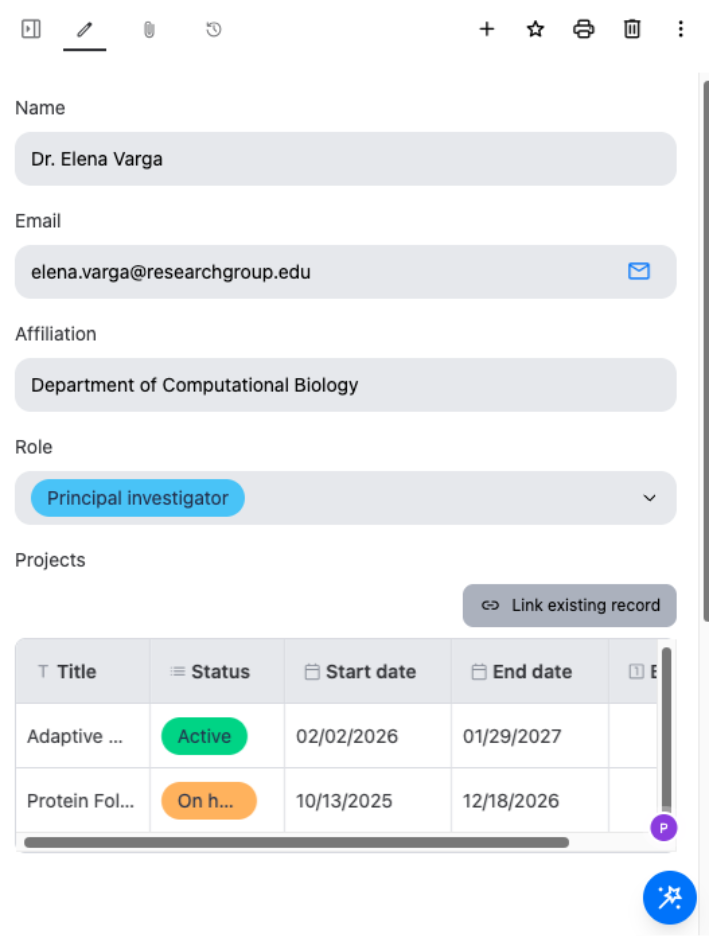
Every table came with search, sorting, filters, and grouping ready to use. The Team members table shows each person's affiliation and role, from principal investigator to student or external collaborator, with each role in its own color. When I opened a record, the form showed the person's contact details, role, and every project they lead, and I could link more projects without leaving it.
Step 2: add a research overview
Tables work well for day-to-day work, but a principal investigator needs to see the whole portfolio at once. So I asked for a dashboard.
Here's the prompt to use:
Add a research overview that shows active projects, total budget, and published papers, with tasks by status, a publication pipeline from drafting to published, and a timeline of all tasks.
Ninox AI listed every component it planned and built the page after my approval. The metrics show active projects, total budget, and published papers. Tasks by status tells you where work stands, and the publication pipeline follows each paper from drafting to submission, review, and publication. At the bottom, a Gantt timeline lays out every task with a marker for today, and you can switch between quarter, month, week, and day.
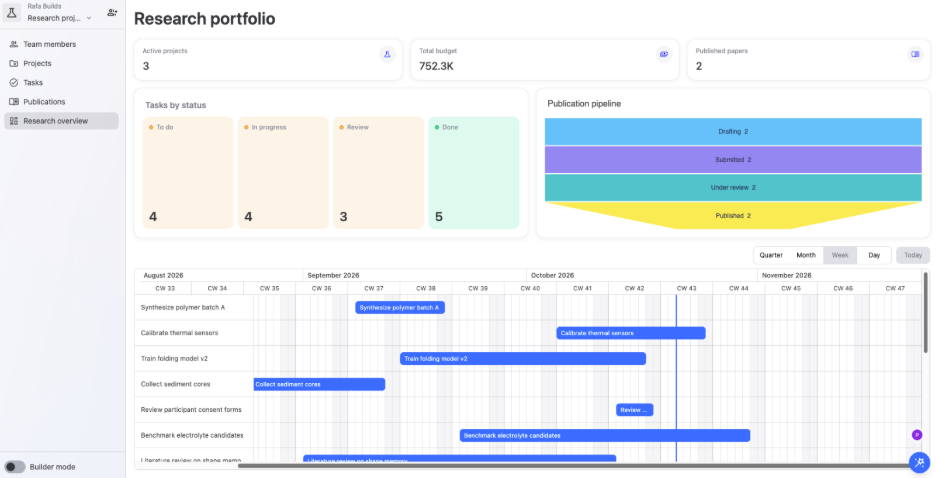
Ninox AI also told me it had tested the dashboard queries but hadn't checked how the page looks on screen. I took a quick look myself, which I'd recommend you do too. Once you move to real data, delete the demo records so they don't skew your numbers.
One setting worth knowing
Research data often comes with strict rules, so it helps that building and data access are two separate decisions in Ninox. In the workspace settings, one switch controls whether Ninox AI can read, add, change, and delete records.
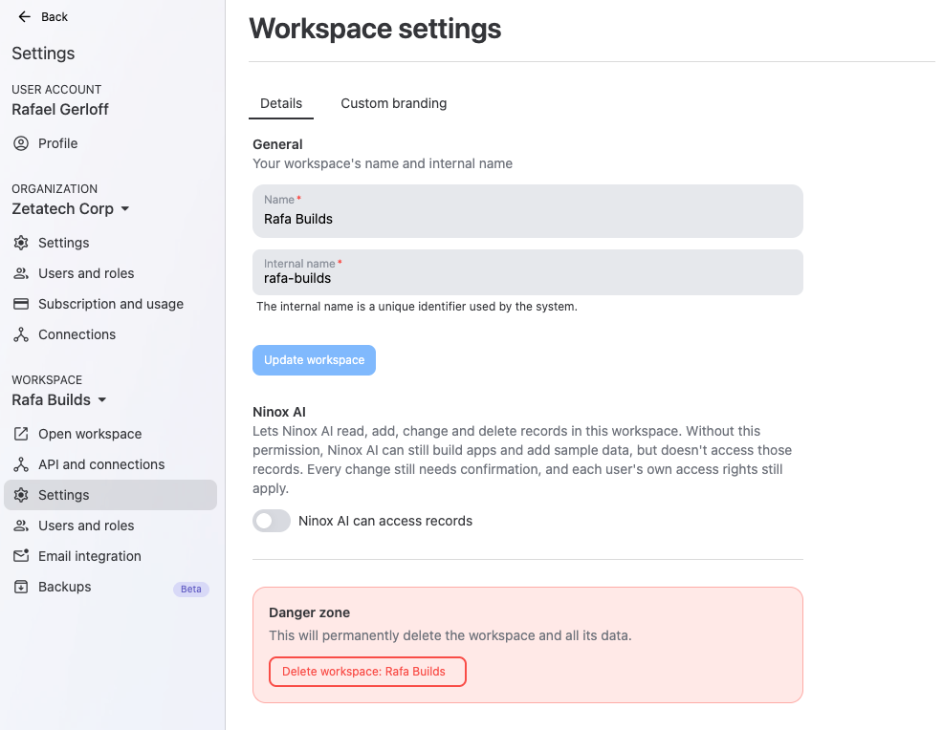
With the switch off, Ninox AI can still build software and add sample data, but it doesn't access your records. With the switch on, every change still needs your confirmation, and each user's own access rights still apply.
Prompts to take your research build further
My two prompts give you a working foundation for your research group. From here, you can keep expanding the same build in plain language. These are the prompts I'd try next:
Show the total budget in euros on the dashboard.
Only let external collaborators see the projects they're part of.
Add a Kanban board of tasks by status for weekly planning.
Add a files field to projects so I can store drafts and reports with each one.
Create a printable progress report for each project that I can send to funders.
And because Ninox is a low-code platform, you never need to write a line of script to build what you've seen here, though anyone on your team who knows scripting can add custom logic when a process calls for it.
The best part of starting on a low-code platform is that nothing here is fixed. Every table, field, and view can change as your projects move from proposal to publication.
This is how much time it took me to build all of this: 3 minutes, 7 seconds.
Take the next step.
Let's figure it out together.