I built software that keeps factory machines running with two short prompts to Ninox AI: one to create the foundation and one to add a plant overview. Below you'll find both prompts, ready to copy, along with what Ninox AI created each time. This is the fifth episode of Built in Ninox, the column where I pick an industry, describe what it needs in plain language, and show you how to build it yourself. This time, we're on the shop floor.
Machine data matters more than most plants admit. According to Siemens, the 500 biggest companies globally lose roughly $1.4 trillion a year to unplanned downtime, about 11% of their total revenues, as AEMT reports. The same report points to the particular challenges SMEs face with downtime costs and recommends digitalisation to stay competitive. You don't need a predictive maintenance project to start. You need one place where every machine, task, and stoppage lives.
One note before you start: our team keeps improving Ninox AI, so your result may look a little different from mine. The structure will be close, and you can always ask Ninox AI to adjust anything that doesn't fit.
Step 1: build the foundation
My first attempt was a single sentence: "I need something to manage the machines in my factory." Ninox AI replied with two quick questions about what to track and whether to add demo data. The prompt below already includes my answers, so you can skip the questions and get the same result in one go. On an AI-native low-code platform, plain language is all you need.
Here's the prompt to use:
I need something to manage the machines in my factory, with maintenance tasks, downtime events, and spare parts. Please add some sample data so I can see how it works.
Before changing anything, Ninox AI showed me the data model and waited for my approval. It proposed four linked tables: Machines, Maintenance tasks, Downtime events, and Spare parts. Every task, stoppage, and part links back to a machine, so opening one machine shows its service history, every breakdown, and the parts that keep it running. After a second approval, Ninox AI filled the tables with 10 machines, 12 maintenance tasks, 10 downtime events, and 10 spare parts.
That alone puts you ahead of many plants. In the long-running Plant Engineering maintenance study, as ReliaMag summarizes, roughly 45 to 55 percent of respondents reported using in-house spreadsheets or schedules, and roughly 39 to 46 percent reported using paper or clipboards, often alongside other software.
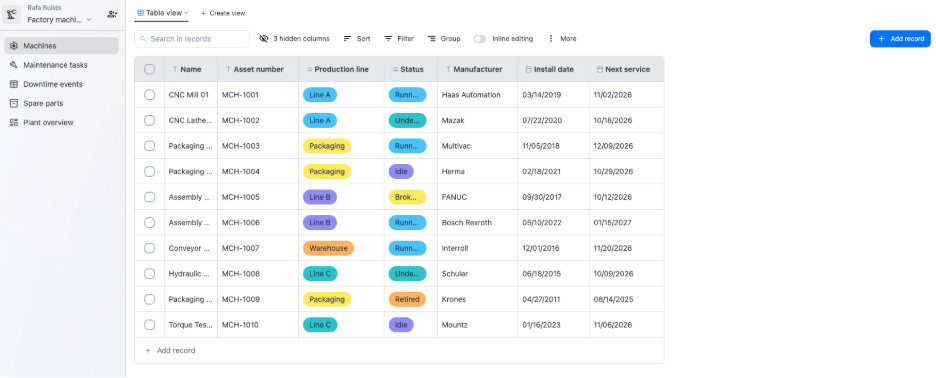
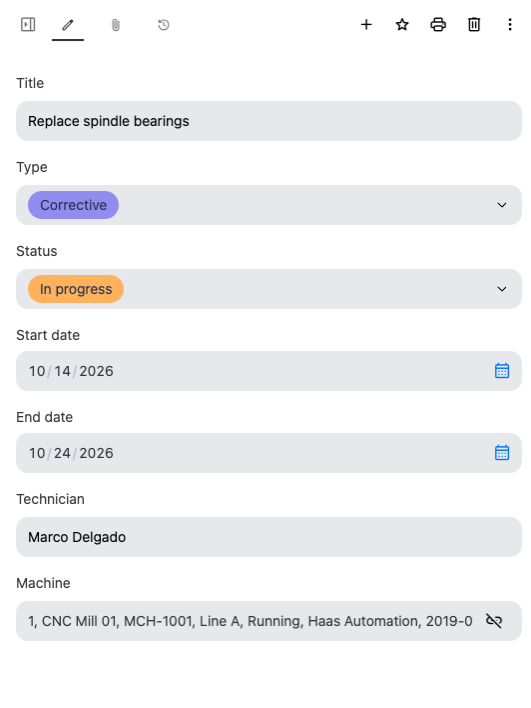
Every table came with search, sorting, filters, and grouping ready to use. Production lines and statuses show up as colored labels, so a broken down machine stands out at a glance. When I opened a maintenance task, the form showed what needs doing, whether it's planned or corrective, its status and dates, the technician, and the machine it belongs to.
Step 2: add a plant overview
Tables work well for handling individual machines, but a plant manager needs the big picture. So I asked for a dashboard.
Here's the prompt to use:
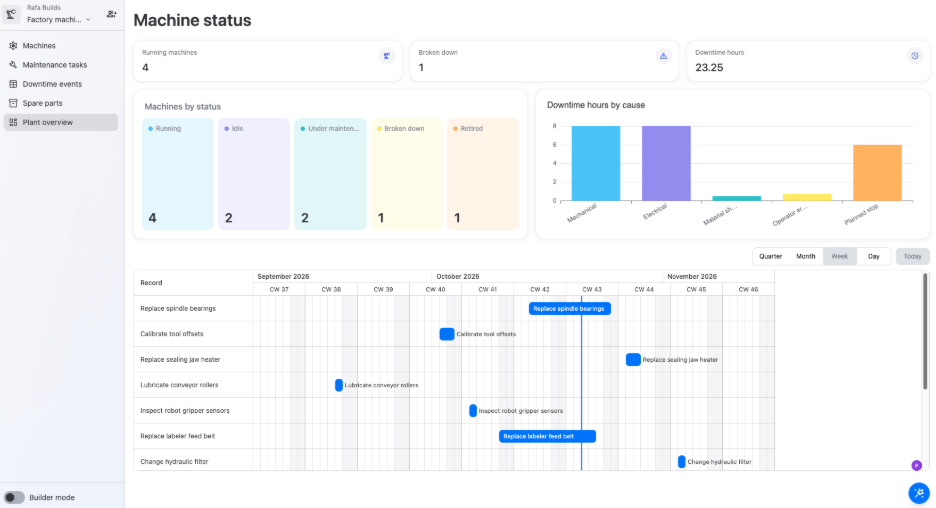
Add a plant overview that shows running machines, broken down machines, and total downtime hours, with charts of machines by status and downtime hours by cause, plus a timeline of maintenance tasks.
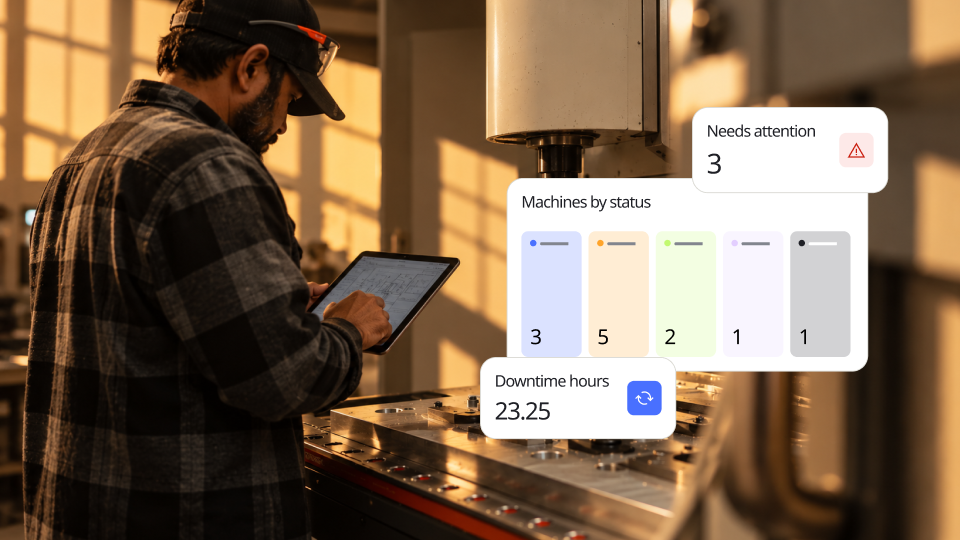
Ninox AI listed every component it planned and built the page after my approval. The metrics show how many machines are running, how many are broken down, and how many hours the plant has lost to downtime. The downtime chart shows where those hours come from, from mechanical and electrical faults to material shortages and planned stops. Below that, a Gantt timeline lays out every maintenance task with a marker for today.
Ninox AI also told me it had tested the dashboard queries but hadn't checked how the page looks on screen. I took a quick look myself, which I'd recommend you do too.
One setting worth knowing
Building and data access are two separate decisions in Ninox. In the workspace settings, one switch controls whether Ninox AI can read, add, change, and delete records.
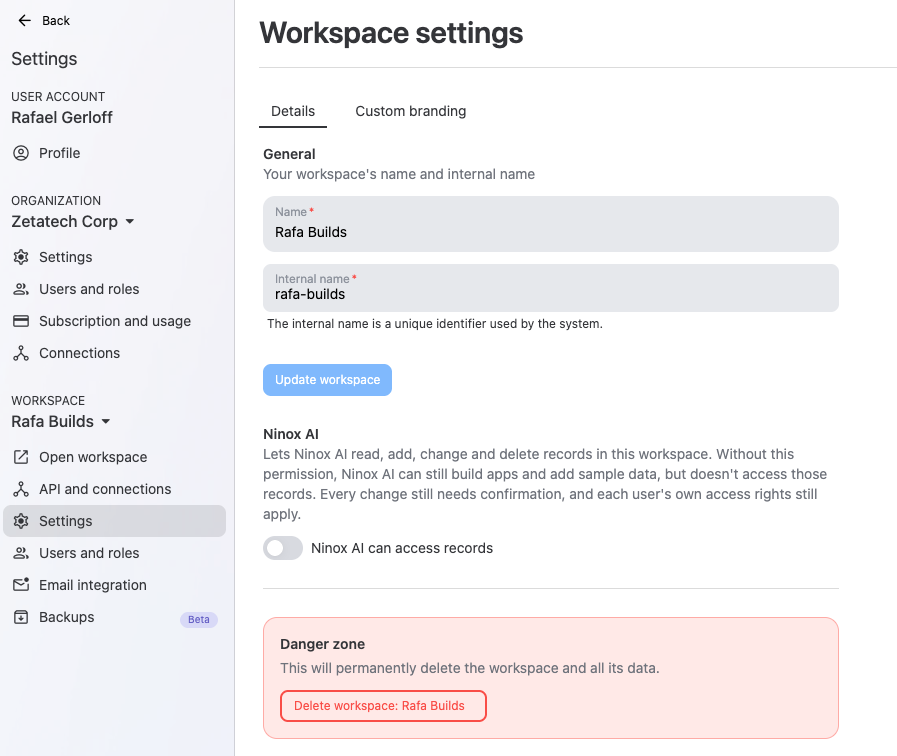
With the switch off, Ninox AI can still build software and add sample data, but it doesn't access your records. With the switch on, every change still needs your confirmation, and each user's own access rights still apply.
Prompts to take your factory build further
My two prompts give you a working foundation for maintenance and downtime tracking. From here, you can keep expanding the same build in plain language. These are the prompts I'd try next:
Show only the machine name in linked machine fields.
Show me all spare parts that have dropped below minimum stock.
Add a form so machine operators can report a stoppage on the spot.
Add a Kanban board of maintenance tasks by status.
Add a signature field so technicians sign off on completed maintenance.
The spare parts prompt is worth trying early. In a Zapium survey, 22 percent of maintenance professionals said they don't track spare parts at all. Connectors can also bring inventory data from weclapp or Xentral into Ninox.
And because Ninox is a low-code platform, you never need to write a line of script to build what you've seen here, though anyone on your team who knows scripting can add custom logic when a process calls for it.
The best part of starting on a low-code platform is that nothing here is fixed. Every table, field, and view can change as you add machines, lines, or new maintenance routines.
This is how much time it took me to build all of this: 2 minutes, 37 seconds.
Take the next step.
Let's figure it out together.