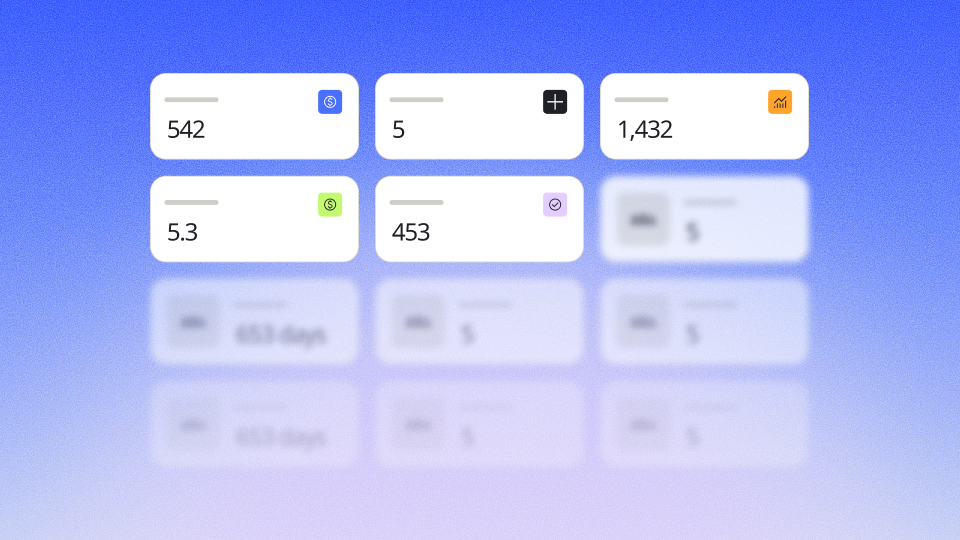
Start with five numbers: how many days of cash you have left, how much customers owe you past the due date, your gross margin, this month's revenue against the same month last year, and the confirmed work already booked for the weeks ahead. Each one answers a question you can act on this week, which is the whole point of a dashboard. Everything else can wait until these five are live, accurate and in one place.
Your accountant's report tells you where you've been
It's the 20th of the month and last month's profit and loss statement has just landed in your inbox. It's accurate, it's what the tax office needs, and it describes a month you can no longer change.
Monthly reports matter. They keep the books clean and give you the long view on profitability. The problem is timing. If the only numbers you see arrive three weeks after the fact, you spend most of every month flying blind, and the decisions that shape next month get made on gut feel.
A dashboard number has to trigger a decision
Here is the test for every figure on a small business dashboard: if it changed tomorrow, would you do something differently? Report numbers describe what happened. Decision numbers tell you what to do next, like chasing an invoice, pausing a hire or raising a price.
The five below pass that test. They're deliberately few, because a dashboard with forty tiles gets glanced at once and then ignored.
Cash buffer days show how long you could keep going
Take your cash balance and divide it by your average daily outflows. The result is the number of days you could keep paying staff, rent and suppliers if every payment coming in stopped tomorrow.
That number is lower than most owners assume. Research by the JPMorgan Chase Institute across 25 US metro areas found that half of small businesses operate with fewer than 15 cash buffer days, and only 40% have more than three weeks. Put this number at the top of your dashboard and update it at least weekly.
Overdue invoices are money you've earned but can't use
Revenue you can't collect doesn't pay bills. Track the total amount past due, split by how late it is, and list the five oldest invoices by name so someone owns the follow-up.
Late payment isn't the exception. The 2026 Atradius barometer, a yearly survey of B2B payment behaviour, found that nearly four in five companies in Western Europe face late payments, and one in four report losses of up to 5% as a result. Seeing an overdue balance creep up on Tuesday lets you nip it in the bud before it turns into a write-off.
Gross margin shows what's left after the work is done
Gross margin is revenue minus the direct cost of delivering it, shown as a percentage. It tells you whether growth is making you money or just keeping you busy.
Track it per product, service or customer, not only as one company-wide figure. A business can grow revenue by 20% while its margin quietly shrinks, because the fastest-growing line is the least profitable one. Your margin is the number that catches that before the year-end accounts do.
Revenue against last year cuts through seasonality
Comparing this month with last month misleads almost every seasonal business. A garden centre's March will always beat its January, and a tax advisor's April will always look busy.
Compare each month with the same month a year earlier instead. That like-for-like view shows whether the business is growing, and it stops a normal seasonal dip from triggering a panic.
Confirmed work in the pipeline is next month's revenue, visible today
The first four numbers look backwards or sideways. This one looks ahead. Add up accepted quotes, signed orders and booked jobs for the next four to eight weeks.
When that total drops, you have time to respond with a campaign, a call round or a price promotion before the revenue gap shows up on your bank statement. Of the five numbers, this is the one that turns a dashboard from a scoreboard into an early warning system.
The five numbers only work if they come from one place
Most small businesses already have every number on this list. The trouble is that cash sits in the bank, invoices in accounting software, costs in a spreadsheet and the pipeline in someone's inbox. A dashboard stitched together by hand every Friday is out of date by Monday.
Ninox is an AI-native low-code platform that can build custom database software, so your customers, orders, invoices and costs live in connected tables, and the dashboard reads from the same data your team works in every day. Connectors bring records in from accounting tools such as Lexware Office, sevdesk or Sage Accounting, and from Excel or Google Sheets. You choose how often the data refreshes or pull it on demand.
On a page, charts sum or count your records directly. A date axis can group revenue by month or quarter, so the year-on-year comparison needs no workaround. Table views can group overdue invoices by age, with a total for each group, and per-record permissions keep margin and cash figures visible only to the people who should see them. Describe the dashboard you want in plain language, and the AI assistant gives you a working starting point to refine.
Because a low-code platform puts the build in your own hands, adding a sixth number later takes an afternoon, not a project. That's the advantage of custom database software over a fixed reporting template: the dashboard grows with the questions your business needs answered.
Late payments are becoming the norm, not the exception
The case for watching these numbers weekly keeps getting stronger. In the same Atradius survey, trade credit now accounts for 52% of all B2B transactions in Western Europe, and more than half of companies don't expect payment behaviour to improve meaningfully in the short term. More selling on credit means more money tied up in invoices, and a small business dashboard that shows cash and overdue balances side by side is the simplest defence. Built on a low-code platform you control, it can stay as current as the business it describes.
Take the next step.